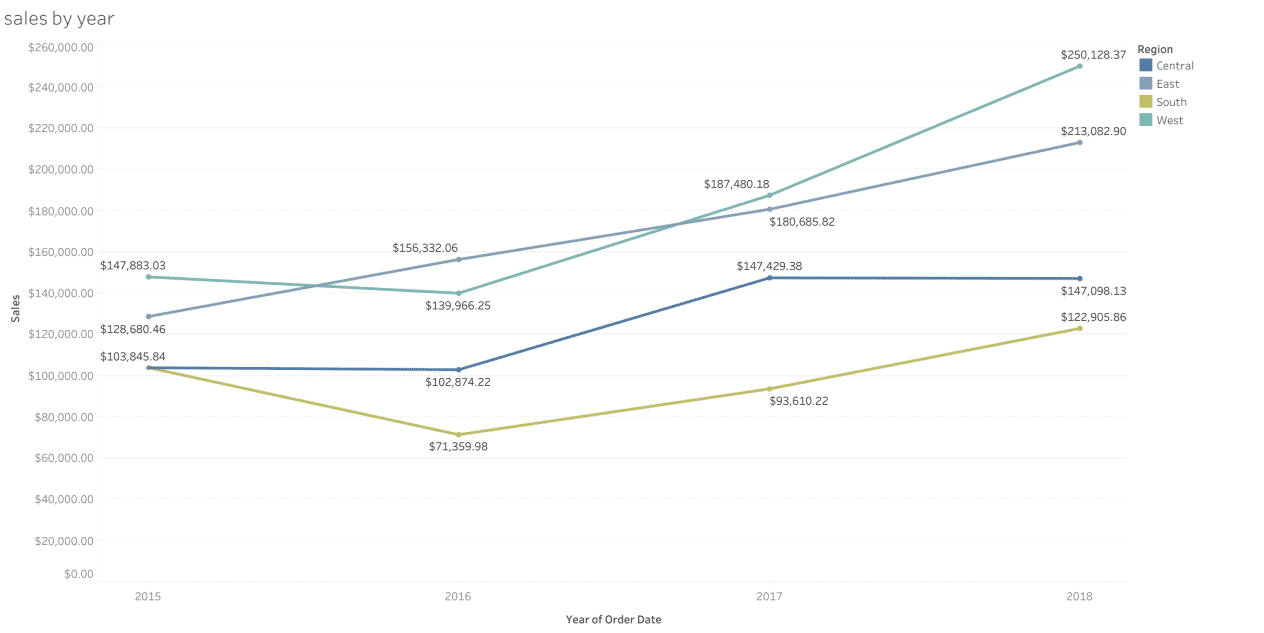

I will use the Tableau application to represent your data in the form of graphs with the type that suits it and shows the relationships in the appropriate way, and the representation will be accurate that meets the purpose in a professional manner
The service provides the following:
Make data more attractive
Facilitate and simplify the understanding of complex data
Ease of making comparisons
Explain the relationships between a set of data
It helps to quickly read data compared to linear data
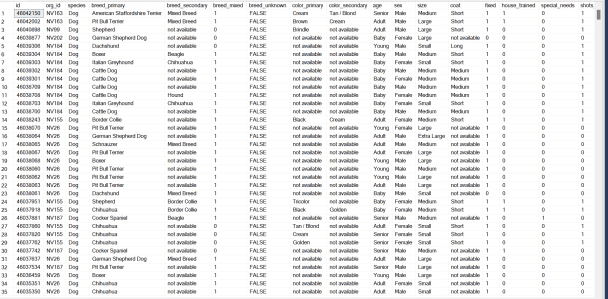
* the service is provided for tabular data (databases) and (spreadsheets) up to 100 rows and 10 columns
* you will receive your result in any format you choose: pdf, doc, jpg ..etc