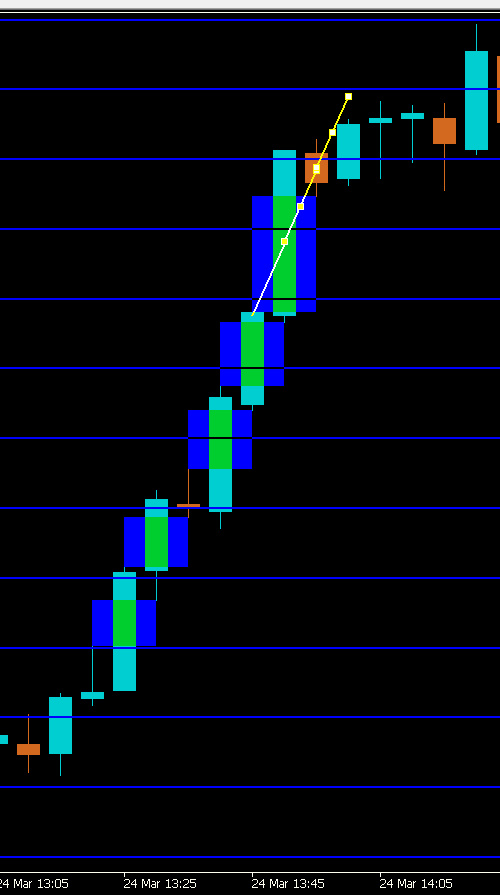
This indicator, called "colorbox", is designed to identify and visualize bullish and bearish gaps on the chart through 3 successif candle . The indicator also calculates stop loss and take profit levels in percentage for these gaps and changes the rectangle color based on whether the stop loss or take profit level is reached if the entry point is on the 3 rd candle that create the gap
. Here is a summary of the indicator's functionality: Counts a specified number of bars (default is 1000) to identify gaps. Identifies bullish gaps where the low of the current bar is higher than the high of the second previous bar. Identifies bearish gaps where the high of the current bar is lower than the low of the second previous bar. Creates rectangles to visualize the bullish and bearish gaps on the chart. Sets custom colors for the bullish and bearish gap rectangles. Sets custom point thresholds and minimum rectangle areas for deleting rectangles. Calculates and sets stop loss and take profit levels in points for the identified gaps. Changes the rectangle color when the stop loss or take profit level is reached. Deletes all rectangles from the chart when the indicator is initialized or deinitialized. To have this indicator translated into a TradingView indicator, provide the following specifications to a freelance developer: Identify bullish and bearish gaps. Create rectangles to visualize gaps on the chart. Set custom colors for bullish and bearish gap rectangles. Set custom point thresholds and minimum rectangle areas for deleting rectangles. Calculate and set stop loss and take profit levels in points for the identified gaps. Change rectangle color when stop loss or take profit level is reached. Delete all rectangles from the chart when the indicator is initialized or deinitialized.
We are looking for senior-level engineers who can take ownership, make architectural decisions, and help transform the current foundation into a secure production DeFi protocol. The opportunity includes: * Competitive compensation * Equity/token incentives *...
We're building on top of a modern Ethereum development framework to improve the developer experience for Web3 applications. The project focuses on enhancing smart contract workflows, expanding reusable frontend components, improving wallet integrations, refining deployment...
We're on the hunt for a Friendly Account Supporter who thrives in a remote working environment and is ready to grow with us! As an Account Supporter, you'll play a key role in ensuring our...
I need an experienced expert to train a high-quality custom face swap model. Requirements: •Train my male face to a specific female appearance (cross-gender and cross-race transformation). •Use DeepFaceLab or DeepAscension fork. •Deliver the trained...
I am looking for a reliable person to work with me on AI-related projects. Developers, communicators, and project coordinators are welcome. The work is remote and flexible. Payment will be agreed upon based on the...
programming a trading bot rules based, also maintenance and implementation if necessary, for BTC perpetual futures on Hyperliquid exchange using a vps, budgetby negotiation, no strict dead line. It is a rather easy task and...
Website Speed Optimization (Core Web Vitals & PageSpeed) I am looking for an experienced web developer to optimize my website's loading speed and overall performance. The goal is to improve Core Web Vitals and achieve...
Are you interested in mobile games and curious about how the mobile gaming industry works? We are building a market intelligence platform used to analyze mobile games, trends and gameplay. We are looking for reliable...
We are looking for a skilled Flutter Developer to help us update, refine, and maintain our existing mobile application. This role is focused on implementing targeted fixes, UI/UX tweaks, and functional updates to ensure a...